C#_automl_classification
Motivation for doing this research
Microsoft has created a script to run their AutoML. I have used this script extensively, and I found the the best estimator for my dataset was the FastTree estimator. I also was compelled to drill down with this estimator to see if I could squeeze out more performance.
In this notebook, I run AutoML for a much longer time to observe the training error curve.
The other reason for doing this analysis was to obtain a trained model that could be executed in milliseconds. Microsoft’s ML.NET does this. The previous posting in this Blog uses Python and TPOT. This is my gold standard model. It took over a week of machine time to train the model. Because TPOT is Python based, I cannot use that model. It takes over 4 seconds to make a prediction using new data. With ML.NET I now have a model that is an order of magnitude faster.
Charles Brauer CBrauer@CypressPoint.com
#r "nuget:Microsoft.ML"
#r "nuget:Microsoft.ML.AutoML"

using System;
using System.Diagnostics;
using System.Linq;
using System.IO;
using System.Linq;

using Microsoft.ML;
using Microsoft.ML.Data;
using Microsoft.ML.AutoML;
using Microsoft.ML.Trainers.FastTree;

using XPlot.Plotly;
Installing package Microsoft.ML…done!
Successfully added reference to package Microsoft.ML, version 1.4.0
Installing package Microsoft.ML.AutoML…done!
Successfully added reference to package Microsoft.ML.AutoML, version 0.16.0
This routine is used to print the progress of the training progress
public class BinaryExperimentProgressHandler:IProgress<RunDetail<BinaryClassificationMetrics>> {
  private int _iterationIndex;
  private double best_f1;

  public void Report(RunDetail<BinaryClassificationMetrics> iterationResult) {
    if (_iterationIndex++ == 0) {
      Console.WriteLine("     Trainer                               Accuracy    AUC       AUPRC   F1-score  Duration");
    }
    var trainerName = iterationResult.TrainerName;
    var accuracy = iterationResult.ValidationMetrics.Accuracy;
    var auc      = iterationResult.ValidationMetrics.AreaUnderRocCurve;
    var aupr     = iterationResult.ValidationMetrics.AreaUnderPrecisionRecallCurve;
    var f1       = iterationResult.ValidationMetrics.F1Score;
    var runtimeInSeconds = iterationResult.RuntimeInSeconds;
    if (f1 > best_f1) {
      best_f1 = f1;
      Console.WriteLine("{0, 4} {1, -35} {2, 9:F4} {3, 9:F4} {4, 9:F4} {5, 9:F4} {6, 9:F4}",
                        _iterationIndex, trainerName, accuracy, auc, aupr, f1, runtimeInSeconds);
    } else {
      Console.Write("{0, 4}\r", _iterationIndex);
    }
  }
}
This routine is used to print a summary of the model’s metrics
private static void PrintMetrics(BinaryClassificationMetrics metrics) {
  Console.WriteLine("  Accuracy........................ {0:f6}", metrics.Accuracy);
  Console.WriteLine("  AreaUnderPrecisionRecallCurve... {0:f6}", metrics.AreaUnderPrecisionRecallCurve);
  Console.WriteLine("  AreaUnderRocCurve............... {0:f6}", metrics.AreaUnderRocCurve);
  Console.WriteLine("  F1Score......................... {0:f6}", metrics.F1Score);
  Console.WriteLine("  NegativePrecision............... {0:f6}", metrics.NegativePrecision);
  Console.WriteLine("  NegativeRecall.................. {0:f6}", metrics.NegativeRecall);
  Console.WriteLine("  PositivePrecision............... {0:f6}", metrics.PositivePrecision);
  Console.WriteLine("  PositiveRecall.................. {0:f6}", metrics.PositiveRecall);

  Console.WriteLine("\nConfusion Matrix:\n{0}", metrics.ConfusionMatrix.GetFormattedConfusionTable());
}
Define the Model input
public class ModelInput     {
  [ColumnName("BoxRatio"), LoadColumn(0)]
  public float BoxRatio { get; set; }
  [ColumnName("Thrust"), LoadColumn(1)]
  public float Thrust { get; set; }
  [ColumnName("Acceleration"), LoadColumn(2)]
  public float Acceleration { get; set; }
  [ColumnName("Velocity"), LoadColumn(3)]
  public float Velocity { get; set; }
  [ColumnName("OnBalRun"), LoadColumn(4)]
  public float OnBalRun { get; set; }
  [ColumnName("vwapGain"), LoadColumn(5)]
  public float VwapGain { get; set; }
  [ColumnName("Altitude"), LoadColumn(6)]
  public bool Altitude { get; set; }
}
Define the Model output
public class ModelOutput     {
  [ColumnName("PredictedLabel")]
  public bool Prediction { get; set; }
  public float Probability { get; set; }
  public float Score { get; set; }
}
This routine loads the Bottle Rocket dataset and trains the model
The program prints only the improved F1 scores, and then summarizes the results.
var sw = Stopwatch.StartNew();
var mlContext = new MLContext(seed: 1);

Console.WriteLine("\nStep 1: Load the Bottle Rocket dataset.");
var trainDataView = mlContext.Data.LoadFromTextFile<ModelInput>(
  path: @"H:\HedgeTools\Datasets\rocket-train-classify-smote.csv",
  hasHeader: true,
  separatorChar: ',');

var validDataView = mlContext.Data.LoadFromTextFile<ModelInput>(
  path: @"H:\HedgeTools\Datasets\rocket-valid-classify.csv",
  hasHeader: true,
  separatorChar: ',');

var optimizingMetrics = new BinaryClassificationMetric[4];
optimizingMetrics[0] = BinaryClassificationMetric.Accuracy;
optimizingMetrics[1] = BinaryClassificationMetric.F1Score;
optimizingMetrics[2] = BinaryClassificationMetric.AreaUnderRocCurve;
optimizingMetrics[3] = BinaryClassificationMetric.AreaUnderPrecisionRecallCurve;

var trainers = new BinaryClassificationTrainer[2];
trainers[0] = BinaryClassificationTrainer.LightGbm;
trainers[1] = BinaryClassificationTrainer.FastTree;

var bestAccuracy = 0.0;
var bestOptimizingMetric = "";
var bestTrainer = "";
var loop = 0;
ExperimentResult<BinaryClassificationMetrics> bestExperimentResult = null;

foreach (var trainer in trainers) {
  foreach (var optimizingMetric in optimizingMetrics) {
    var settings = new BinaryExperimentSettings {
      MaxExperimentTimeInSeconds = 1 * 30 * 60,
      OptimizingMetric = optimizingMetric,
      CacheDirectory = null
    };
    settings.Trainers.Clear();
    settings.Trainers.Add(trainer);

    Console.WriteLine("\n" + (++loop) + ": Running AutoML binary classification experiment using: " +
                      trainer.ToString() + ", " + optimizingMetric.ToString()
                     );
    var experimentResult =
        mlContext.Auto().CreateBinaryClassificationExperiment(settings)
                        .Execute(trainData: trainDataView,
                                 labelColumnName: "Altitude",
                                 progressHandler: new BinaryExperimentProgressHandler());

    var bestRun = experimentResult.BestRun;

    Console.WriteLine("Total models produced.... {0}", experimentResult.RunDetails.Count());
            var validDataViewWithBestScore = bestRun.Model.Transform(validDataView);
            var validMetrics = mlContext.BinaryClassification.EvaluateNonCalibrated(data: validDataViewWithBestScore,
                                                                                    labelColumnName: "Altitude");
            Console.WriteLine("\nMetrics using validation dataset:");
            PrintMetrics(validMetrics);

    var crossValidationResults =
        mlContext.BinaryClassification.CrossValidateNonCalibrated(validDataView,
                                                                  bestRun.Estimator,
                                                                  numberOfFolds: 6,
                                                                  labelColumnName:
                                                                  "Altitude");
    var metricsInMultipleFolds = crossValidationResults.Select(r => r.Metrics);
    var AccuracyValues = metricsInMultipleFolds.Select(m => m.Accuracy);
    var accuracyValues = AccuracyValues as double[] ?? AccuracyValues.ToArray();
    var AccuracyAverage = accuracyValues.Average();
    double average = accuracyValues.Average();
    double sumOfSquaresOfDifferences = accuracyValues.Select(val => (val - average) * (val - average)).Sum();
    double AccuraciesStdDeviation = Math.Sqrt(sumOfSquaresOfDifferences / (accuracyValues.Length - 1));
    double confidenceInterval95 = 1.96 * AccuraciesStdDeviation / Math.Sqrt((accuracyValues.Length - 1));
    var AccuraciesConfidenceInterval95 = confidenceInterval95;

    if (AccuracyAverage > bestAccuracy) {
      bestAccuracy = AccuracyAverage;
      bestTrainer = bestRun.TrainerName;
      bestOptimizingMetric = optimizingMetric.ToString();
      bestExperimentResult = experimentResult;
      Console.WriteLine("\nBest model's trainer............ {0}", bestTrainer);
      Console.WriteLine("Best model's optimizingMetric... {0}", bestOptimizingMetric);
      Console.WriteLine("Cross Validation Metric: ");
      Console.WriteLine("  Average Accuracy: {0:f4}, Standard deviation: {1:f4}, Confidence Interval 95%: {2:f4}",
        AccuracyAverage, AccuraciesStdDeviation, AccuraciesConfidenceInterval95);

      var mlModel = bestRun.Model;
      mlContext.Model.Save(mlModel, trainDataView.Schema, "./MLModel.zip");
      Console.WriteLine("Done. The model is saved.");
    }
  }
}
Step 1: Load the Bottle Rocket dataset.

1: Running AutoML binary classification experiment using: LightGbm, Accuracy
     Trainer                               Accuracy    AUC       AUPRC   F1-score  Duration
   1 LightGbmBinary                         0.8048    0.8802    0.8925    0.8017    4.1021
   2 LightGbmBinary                         0.8353    0.9124    0.9137    0.8237    8.8050
   8 LightGbmBinary                         0.8915    0.9524    0.9581    0.8936   15.6461
  62 LightGbmBinary                         0.8942    0.9465    0.9556    0.8965   17.4921
  79 LightGbmBinary                         0.8950    0.9563    0.9611    0.8981   14.8344
  92 LightGbmBinary                         0.8978    0.9581    0.9652    0.9017   12.2783
Total models produced.... 198

Metrics using validation dataset:
  Accuracy........................ 0.836847
  AreaUnderPrecisionRecallCurve... 0.787978
  AreaUnderRocCurve............... 0.876020
  F1Score......................... 0.701342
  NegativePrecision............... 0.887395
  NegativeRecall.................. 0.888141
  PositivePrecision............... 0.702128
  PositiveRecall.................. 0.700559

Confusion Matrix:
TEST POSITIVE RATIO:	0.2734 (895.0/(895.0+2378.0))
Confusion table
          ||======================
PREDICTED || positive | negative | Recall
TRUTH     ||======================
 positive ||      627 |      268 | 0.7006
 negative ||      266 |    2 112 | 0.8881
          ||======================
Precision ||   0.7021 |   0.8874 |


Best model's trainer............ LightGbmBinary
Best model's optimizingMetric... Accuracy
Cross Validation Metric:
  Average Accuracy: 0.7996, Standard deviation: 0.0086, Confidence Interval 95%: 0.0076
Done. The model is saved.

2: Running AutoML binary classification experimeent using: LightGbm, F1Score
     Trainer                               Accuracy    AUC       AUPRC   F1-score  Duration
   1 LightGbmBinary                         0.8050    0.8838    0.8876    0.7894    3.5057
   2 LightGbmBinary                         0.8034    0.8848    0.8993    0.8042    6.1197
   8 LightGbmBinary                         0.8590    0.9289    0.9375    0.8579    8.9197
  19 LightGbmBinary                         0.8670    0.9433    0.9503    0.8725    9.9242
  24 LightGbmBinary                         0.8864    0.9471    0.9557    0.8889   15.3275
  25 LightGbmBinary                         0.8866    0.9532    0.9598    0.8917   13.3286
  63 LightGbmBinary                         0.8942    0.9524    0.9581    0.8959   13.0294
  91 LightGbmBinary                         0.8989    0.9581    0.9629    0.8988   12.7727
Total models produced.... 196

Metrics using validation dataset:
  Accuracy........................ 0.833792
  AreaUnderPrecisionRecallCurve... 0.781009
  AreaUnderRocCurve............... 0.870147
  F1Score......................... 0.702407
  NegativePrecision............... 0.891880
  NegativeRecall.................. 0.877628
  PositivePrecision............... 0.688103
  PositiveRecall.................. 0.717318

Confusion Matrix:
TEST POSITIVE RATIO:	0.2734 (895.0/(895.0+2378.0))
Confusion table
          ||======================
PREDICTED || positive | negative | Recall
TRUTH     ||======================
 positive ||      642 |      253 | 0.7173
 negative ||      291 |    2 087 | 0.8776
          ||======================
Precision ||   0.6881 |   0.8919 |


3: Running AutoML binary classification experimeent using: LightGbm, AreaUnderRocCurve
     Trainer                               Accuracy    AUC       AUPRC   F1-score  Duration
   1 LightGbmBinary                         0.8050    0.8838    0.8876    0.7894    4.1777
   3 LightGbmBinary                         0.8013    0.8848    0.8995    0.8052    2.2853
   4 LightGbmBinary                         0.8142    0.8981    0.9069    0.8126    3.6899
   9 LightGbmBinary                         0.8251    0.9150    0.9253    0.8259    6.8250
  20 LightGbmBinary                         0.8727    0.9430    0.9433    0.8644    9.6666
  29 LightGbmBinary                         0.8775    0.9462    0.9523    0.8815    9.8766
  31 LightGbmBinary                         0.8824    0.9459    0.9449    0.8842   10.3500
  36 LightGbmBinary                         0.8847    0.9496    0.9551    0.8861    9.8303
  42 LightGbmBinary                         0.8902    0.9490    0.9535    0.8914   12.2504
  82 LightGbmBinary                         0.8894    0.9556    0.9608    0.8937   15.2517
  90 LightGbmBinary                         0.8922    0.9530    0.9576    0.8942   13.3331
  95 LightGbmBinary                         0.8976    0.9569    0.9615    0.8991   15.3605
 135 LightGbmBinary                         0.8990    0.9546    0.9601    0.9001   15.5735
 183 LightGbmBinary                         0.8971    0.9538    0.9607    0.9013   12.9670
Total models produced.... 189

Metrics using validation dataset:
  Accuracy........................ 0.838375
  AreaUnderPrecisionRecallCurve... 0.795228
  AreaUnderRocCurve............... 0.879851
  F1Score......................... 0.705948
  NegativePrecision............... 0.890249
  NegativeRecall.................. 0.886880
  PositivePrecision............... 0.702434
  PositiveRecall.................. 0.709497

Confusion Matrix:
TEST POSITIVE RATIO:	0.2734 (895.0/(895.0+2378.0))
Confusion table
          ||======================
PREDICTED || positive | negative | Recall
TRUTH     ||======================
 positive ||      635 |      260 | 0.7095
 negative ||      269 |    2 109 | 0.8869
          ||======================
Precision ||   0.7024 |   0.8902 |


4: Running AutoML binary classification experimeent using: LightGbm, AreaUnderPrecisionRecallCurve
     Trainer                               Accuracy    AUC       AUPRC   F1-score  Duration
   1 LightGbmBinary                         0.7905    0.8764    0.8932    0.7829    3.5890
  10 LightGbmBinary                         0.8382    0.9213    0.9232    0.8389    7.3470
  16 LightGbmBinary                         0.8615    0.9318    0.9429    0.8656    7.1917
  25 LightGbmBinary                         0.8793    0.9443    0.9539    0.8808   11.5563
  26 LightGbmBinary                         0.8929    0.9501    0.9563    0.8948   13.6540
  55 LightGbmBinary                         0.9024    0.9595    0.9579    0.9040   14.8611
 160
Load the “best” model that was saved above
var threshold = 0.5;
var modelPath = "./MLModel.zip";
var mlContext = new MLContext();
if (!File.Exists(modelPath)) {
  Console.WriteLine("Cannot find MLModel.zip");
  return;
}
DataViewSchema modelSchema;
var mlModel = mlContext.Model.Load(modelPath, out modelSchema);
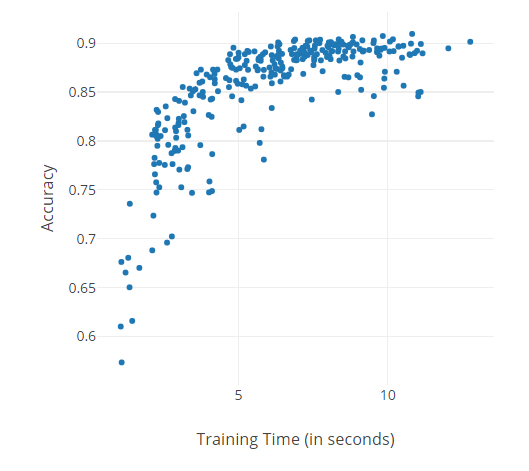
Let’s plot the improvement of the Accuracy score as the training time increases.
var scatters = bestExperimentResult.RunDetails.Where(d => d.ValidationMetrics != null).GroupBy(
    r => r.TrainerName,
    (name, details) => new Graph.Scatter() {
        name = name,
        x = details.Select(r => r.RuntimeInSeconds),
        y = details.Select(r => r.ValidationMetrics.Accuracy),
        mode = "markers",
        marker = new Graph.Marker() { size = 5 }
    }
);

var chart1 = Chart.Plot(scatters);
chart1.WithXTitle("Training Time (in seconds)");
chart1.WithYTitle("Accuracy");
chart1.Width = 500;
chart1.Height = 500;
display(chart1)
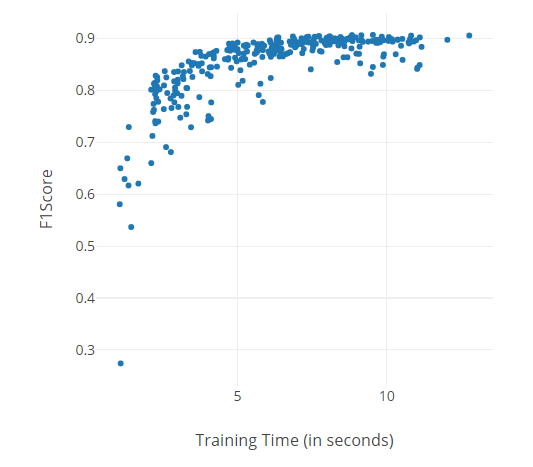
Plot the improvement of the F1Score as the training time increases.
var scatters = bestExperimentResult.RunDetails.Where(d => d.ValidationMetrics != null).GroupBy(
    r => r.TrainerName,
    (name, details) => new Graph.Scatter() {
        name = name,
        x = details.Select(r => r.RuntimeInSeconds),
        y = details.Select(r => r.ValidationMetrics.F1Score),
        mode = "markers",
        marker = new Graph.Marker() { size = 5 }
    }
);

var chart2 = Chart.Plot(scatters);
chart2.WithXTitle("Training Time (in seconds)");
chart2.WithYTitle("F1Score");
chart2.Width = 500;
chart2.Height = 500;
display(chart2);
Run cross-validation using the validation dataset.
var validDataView = mlContext.Data.LoadFromTextFile<ModelInput>(
  path: @"H:\HedgeTools\Datasets\rocket-valid-classify.csv",
  hasHeader: true,
  separatorChar: ',');

var bestRun = bestExperimentResult.BestRun;
var validDataViewWithBestScore = bestRun.Model.Transform(validDataView);
var validMetrics = mlContext.BinaryClassification.EvaluateNonCalibrated(data: validDataViewWithBestScore,
                                                                        labelColumnName: "Altitude");
Console.WriteLine("\nMetrics of best model on validation data:");
PrintMetrics(validMetrics);

var crossValidationResults = mlContext.BinaryClassification.CrossValidateNonCalibrated(validDataView,
                                                                                       bestRun.Estimator,
                                                                                       numberOfFolds: 6,
                                                                                       labelColumnName: "Altitude");
var metricsInMultipleFolds = crossValidationResults.Select(r => r.Metrics);
var AccuracyValues = metricsInMultipleFolds.Select(m => m.Accuracy);
var accuracyValues = AccuracyValues as double[] ?? AccuracyValues.ToArray();
var AccuracyAverage = accuracyValues.Average();
double average = accuracyValues.Average();
double sumOfSquaresOfDifferences = accuracyValues.Select(val => (val - average) * (val - average)).Sum();
double AccuraciesStdDeviation = Math.Sqrt(sumOfSquaresOfDifferences / (accuracyValues.Length - 1));
double confidenceInterval95 = 1.96 * AccuraciesStdDeviation / Math.Sqrt((accuracyValues.Length - 1));
var AccuraciesConfidenceInterval95 = confidenceInterval95;
Console.WriteLine("Cross Validation Metrics:");
Console.WriteLine("  Average Accuracy: {0:f4}, Standard deviation: {1:f4}, Confidence Interval 95%: {2:f4}",
                  AccuracyAverage, AccuraciesStdDeviation, AccuraciesConfidenceInterval95);
Metrics of best model on validation data:
  Accuracy........................ 0.838688
  AreaUnderPrecisionRecallCurve... 0.720566
  AreaUnderRocCurve............... 0.861095
  F1Score......................... 0.631340
  NegativePrecision............... 0.905006
  NegativeRecall.................. 0.888655
  PositivePrecision............... 0.611437
  PositiveRecall.................. 0.652582

Confusion Matrix:
TEST POSITIVE RATIO:	0.2117 (639.0/(639.0+2380.0))
Confusion table
          ||======================
PREDICTED || positive | negative | Recall
TRUTH     ||======================
 positive ||      417 |      222 | 0.6526
 negative ||      265 |    2 115 | 0.8887
          ||======================
Precision ||   0.6114 |   0.9050 |

Cross Validation Metrics:
  Average Accuracy: 0.8331, Standard deviation: 0.0150, Confidence Interval 95%: 0.0131
Evaluate the performance using the test dataset
This data was not seen by the training of the model. It is used to test what we can expect in the actual use of the model.
var testDataPath = @"H:\HedgeTools\Datasets\rocket-test-classify.csv";
var testDataView = mlContext.Data.LoadFromTextFile<ModelInput>(
  path: testDataPath,
  hasHeader: true,
  separatorChar: ',');

var testDataViewWithBestScore = bestRun.Model.Transform(testDataView);
var testMetrics = mlContext.BinaryClassification.EvaluateNonCalibrated(data: testDataViewWithBestScore,
                                                                       labelColumnName: "Altitude");
Console.WriteLine("\nMetrics using the test data:");
PrintMetrics(testMetrics);
Metrics using the test data:
  Accuracy........................ 0.846638
  AreaUnderPrecisionRecallCurve... 0.716333
  AreaUnderRocCurve............... 0.848605
  F1Score......................... 0.639689
  NegativePrecision............... 0.900504
  NegativeRecall.................. 0.904682
  PositivePrecision............... 0.645212
  PositiveRecall.................. 0.634259

Confusion Matrix:
TEST POSITIVE RATIO:	0.2146 (648.0/(648.0+2371.0))
Confusion table
          ||======================
PREDICTED || positive | negative | Recall
TRUTH     ||======================
 positive ||      411 |      237 | 0.6343
 negative ||      226 |    2 145 | 0.9047
          ||======================
Precision ||   0.6452 |   0.9005 |
Define a method to Predict the classification of the pattern.
This will simulate the prediction code on a line of new data.
public void Predict(string predictors, double threshold, out int predicted, out double probability) {
  try {

    var predEngine = mlContext.Model.CreatePredictionEngine<ModelInput, ModelOutput>(mlModel);
    var modelInput = new ModelInput();
    var fields = predictors.Split(',');

    modelInput.BoxRatio     = Convert.ToSingle(fields[0]);
    modelInput.Thrust       = Convert.ToSingle(fields[1]);
    modelInput.Acceleration = Convert.ToSingle(fields[2]);
    modelInput.Velocity     = Convert.ToSingle(fields[3]);
    modelInput.OnBalRun     = Convert.ToSingle(fields[4]);
    modelInput.VwapGain     = Convert.ToSingle(fields[5]);

    var prediction = predEngine.Predict(modelInput);
    predicted = prediction.Prediction ? 1 : 0;
    probability = Math.Round(prediction.Probability, 8);

    if (predicted == 1 && probability < threshold) {
      // Console.WriteLine("Corrected prediction 1 to 0 because probability {0:f8} < {1:f2}",
      //                   probability, threshold);
      predicted = 0;
    }

    if (predicted == 0 && probability >= threshold) {
      Console.WriteLine("We should never come here.");
      predicted = 1;
    }

    return;
  } catch (EndOfStreamException ex) {
    Console.WriteLine("Predict error: " + ex.Message);
  } catch (Exception ex) {
    Console.WriteLine("Predict error: " + ex.Message);
  }
  predicted = 0;
  probability = 0.0;
}
Let’s simulate the production environment by using the test data, a line at a time.
Console.WriteLine("Using dataset:" + testDataPath);
var tableRows = new List<string>();

try {
  var reader = new StreamReader(File.OpenRead(testDataPath));
  reader.ReadLine(); // Ignore the header
  while (!reader.EndOfStream) {
    var line = reader.ReadLine();
    tableRows.Add(line);
  }
  reader.Close();
} catch (Exception ex) {
  Console.WriteLine("Oh drat! We have an error: " + ex.Message);
  return;
}

int false_positive, true_negative, false_negative;
var true_positive = false_positive = true_negative = false_negative = 0;
double goal_met = 0.0, goal_failed = 0.0, probability;
var max_corrected = 0;
var nrows = tableRows.Count;
sw = Stopwatch.StartNew();
var best_threshold = 0.0;
var max_accuracy = 0.0;
Console.WriteLine("\nComputing Metrics using the test dataset, nrows: " + nrows);

for (var threshold = 0.50; threshold < 0.96; threshold += 0.02) {
  var true_positive = 0;
  var false_positive = 0;
  var false_negative = 0;
  var true_negative = 0;
  double goal_met = 0.0, goal_failed = 0.0;
  var corrected = 0;

  foreach (var predictors in tableRows) {
    int altitude, predicted;
    double probability;
    try {
      var fields = predictors.Split(',');
      altitude = Convert.ToInt32(fields[6]);
      // Drop the "Altitude" field, leaving only the "features'.
      var features = string.Join(",", fields.Take(fields.Length - 1));

      // An Altitude of 1 means that the goal wa reached. This is a "ground truth" value.
      // The probability here is simply the probability that a given prediction is True (i.e. 1).
      // If the probability is less than the threshold then it is more likely to be False than True,
      // thus we change the predicion to False (i.e. 0).

      Predict(features, threshold, out predicted, out probability);
    } catch (Exception) {
      Console.WriteLine("dataset is not in the proper format. Did you delete the index column?");
      return;
    }

    if (altitude == 1) {
      goal_met++;
    } else {
      goal_failed++;
    }

    if (predicted == 1 && altitude == 1) {
      // We have found a True Positive. The model predicted a gain and we got it.
      true_positive += 1;
    }

    if (predicted == 1 && altitude == 0) {
      // We have found a False Positive. The model predicted a gain, but we got a loss.
      false_positive += 1;
    }

    if (predicted == 0 && altitude == 1) {
      // We have found a False Negative. The model predicted a loss, but we got a gain.
      false_negative += 1;
    }

    if (predicted == 0 && altitude == 0) {
      // We have found a True Negative. The model predicted a loss, and we got it.
      true_negative += 1;
    }
  }

  var total = Convert.ToDouble(true_positive + false_positive + true_negative + false_negative);
  var accuracy = 100.0 * (true_positive + true_negative) / total;
  accuracy = Math.Round(accuracy, 4);

  Console.WriteLine("accurancy: {0:f4}, max_accuracy: {1:f4}, threshold: {2:f2}",
                    accuracy, max_accuracy, threshold);
  if (accuracy > max_accuracy) {
    max_accuracy = accuracy;

    double recall, f1score;
    var precision = recall = f1score = 0.0;

    var denom = Convert.ToDouble(true_positive + false_negative);
    if (denom > 0.0) recall = true_positive / denom;

    denom = Convert.ToDouble(true_positive + false_positive);
    if (denom > 0.0) precision = true_positive / denom;

    if (precision + recall > 0.0) f1score = 2.0 * (precision * recall) / (precision + recall);
    precision = Math.Round(precision, 4);
    recall = Math.Round(recall, 4);
    f1score = Math.Round(f1score, 4);
    best_threshold = threshold;

    Console.WriteLine("Metrics:");
    Console.WriteLine("  threshold................. {0:f2}", threshold);
    Console.WriteLine("  No. of True Positive...... {0}/{1}", true_positive, goal_met);
    Console.WriteLine("  No. of False Positive..... {0}", false_positive);
    Console.WriteLine("  No. of False Negative..... {0}", false_negative);
    Console.WriteLine("  No. of True Negative...... {0}/{1}", true_negative, goal_failed);
    Console.WriteLine("  Accuracy.................. {0:f4}%", accuracy);
    Console.WriteLine("  Precision................. {0:f4}" + precision);
    Console.WriteLine("  Recall.................... {0:f4}" + recall);
    Console.WriteLine("  F1 Score.................. {0:f4}" + f1score);
  }
}
Console.WriteLine("Done. The best threshold is {0:f2}", best_threshold);
Using dataset:H:\HedgeTools\Datasets\rocket-test-classify.csv

Computing Metrics using the test dataset, nrows: 3019
accurancy: 84.6638, max_accuracy: 0.0000, threshold: 0.50
Metrics:
  threshold................. 0.50
  No. of True Positive...... 411/648
  No. of False Positive..... 226
  No. of False Negative..... 237
  No. of True Negative...... 2145/2371
  Accuracy.................. 84.6638%
  Precision................. {0:f4}0.6452
  Recall.................... {0:f4}0.6343
  F1 Score.................. {0:f4}0.6397
accurancy: 84.7300, max_accuracy: 84.6638, threshold: 0.52
Metrics:
  threshold................. 0.52
  No. of True Positive...... 410/648
  No. of False Positive..... 223
  No. of False Negative..... 238
  No. of True Negative...... 2148/2371
  Accuracy.................. 84.7300%
  Precision................. {0:f4}0.6477
  Recall.................... {0:f4}0.6327
  F1 Score.................. {0:f4}0.6401
accurancy: 85.0282, max_accuracy: 84.7300, threshold: 0.54
Metrics:
  threshold................. 0.54
  No. of True Positive...... 407/648
  No. of False Positive..... 211
  No. of False Negative..... 241
  No. of True Negative...... 2160/2371
  Accuracy.................. 85.0282%
  Precision................. {0:f4}0.6586
  Recall.................... {0:f4}0.6281
  F1 Score.................. {0:f4}0.643
accurancy: 85.2600, max_accuracy: 85.0282, threshold: 0.56
Metrics:
  threshold................. 0.56
  No. of True Positive...... 405/648
  No. of False Positive..... 202
  No. of False Negative..... 243
  No. of True Negative...... 2169/2371
  Accuracy.................. 85.2600%
  Precision................. {0:f4}0.6672
  Recall.................... {0:f4}0.625
  F1 Score.................. {0:f4}0.6454
accurancy: 85.4256, max_accuracy: 85.2600, threshold: 0.58
Metrics:
  threshold................. 0.58
  No. of True Positive...... 404/648
  No. of False Positive..... 196
  No. of False Negative..... 244
  No. of True Negative...... 2175/2371
  Accuracy.................. 85.4256%
  Precision................. {0:f4}0.6733
  Recall.................... {0:f4}0.6235
  F1 Score.................. {0:f4}0.6474
accurancy: 85.4919, max_accuracy: 85.4256, threshold: 0.60
Metrics:
  threshold................. 0.60
  No. of True Positive...... 402/648
  No. of False Positive..... 192
  No. of False Negative..... 246
  No. of True Negative...... 2179/2371
  Accuracy.................. 85.4919%
  Precision................. {0:f4}0.6768
  Recall.................... {0:f4}0.6204
  F1 Score.................. {0:f4}0.6473
accurancy: 85.5250, max_accuracy: 85.4919, threshold: 0.62
Metrics:
  threshold................. 0.62
  No. of True Positive...... 399/648
  No. of False Positive..... 188
  No. of False Negative..... 249
  No. of True Negative...... 2183/2371
  Accuracy.................. 85.5250%
  Precision................. {0:f4}0.6797
  Recall.................... {0:f4}0.6157
  F1 Score.................. {0:f4}0.6462
accurancy: 85.6575, max_accuracy: 85.5250, threshold: 0.64
Metrics:
  threshold................. 0.64
  No. of True Positive...... 397/648
  No. of False Positive..... 182
  No. of False Negative..... 251
  No. of True Negative...... 2189/2371
  Accuracy.................. 85.6575%
  Precision................. {0:f4}0.6857
  Recall.................... {0:f4}0.6127
  F1 Score.................. {0:f4}0.6471
accurancy: 85.8894, max_accuracy: 85.6575, threshold: 0.66
Metrics:
  threshold................. 0.66
  No. of True Positive...... 395/648
  No. of False Positive..... 173
  No. of False Negative..... 253
  No. of True Negative...... 2198/2371
  Accuracy.................. 85.8894%
  Precision................. {0:f4}0.6954
  Recall.................... {0:f4}0.6096
  F1 Score.................. {0:f4}0.6497
accurancy: 86.0881, max_accuracy: 85.8894, threshold: 0.68
Metrics:
  threshold................. 0.68
  No. of True Positive...... 392/648
  No. of False Positive..... 164
  No. of False Negative..... 256
  No. of True Negative...... 2207/2371
  Accuracy.................. 86.0881%
  Precision................. {0:f4}0.705
  Recall.................... {0:f4}0.6049
  F1 Score.................. {0:f4}0.6512
accurancy: 86.2206, max_accuracy: 86.0881, threshold: 0.70
Metrics:
  threshold................. 0.70
  No. of True Positive...... 387/648
  No. of False Positive..... 155
  No. of False Negative..... 261
  No. of True Negative...... 2216/2371
  Accuracy.................. 86.2206%
  Precision................. {0:f4}0.714
  Recall.................... {0:f4}0.5972
  F1 Score.................. {0:f4}0.6504
accurancy: 86.4856, max_accuracy: 86.2206, threshold: 0.72
Metrics:
  threshold................. 0.72
  No. of True Positive...... 385/648
  No. of False Positive..... 145
  No. of False Negative..... 263
  No. of True Negative...... 2226/2371
  Accuracy.................. 86.4856%
  Precision................. {0:f4}0.7264
  Recall.................... {0:f4}0.5941
  F1 Score.................. {0:f4}0.6537
accurancy: 86.4856, max_accuracy: 86.4856, threshold: 0.74
accurancy: 86.4856, max_accuracy: 86.4856, threshold: 0.76
accurancy: 86.4525, max_accuracy: 86.4856, threshold: 0.78
accurancy: 86.3200, max_accuracy: 86.4856, threshold: 0.80
accurancy: 86.4193, max_accuracy: 86.4856, threshold: 0.82
accurancy: 86.4193, max_accuracy: 86.4856, threshold: 0.84
accurancy: 86.5187, max_accuracy: 86.4856, threshold: 0.86
Metrics:
  threshold................. 0.86
  No. of True Positive...... 340/648
  No. of False Positive..... 99
  No. of False Negative..... 308
  No. of True Negative...... 2272/2371
  Accuracy.................. 86.5187%
  Precision................. {0:f4}0.7745
  Recall.................... {0:f4}0.5247
  F1 Score.................. {0:f4}0.6256
accurancy: 86.4856, max_accuracy: 86.5187, threshold: 0.88
accurancy: 86.4193, max_accuracy: 86.5187, threshold: 0.90
accurancy: 86.4193, max_accuracy: 86.5187, threshold: 0.92
accurancy: 85.9225, max_accuracy: 86.5187, threshold: 0.94
Done. The best threshold is 0.86
Summary
In this notebook, we have gone into deeper analysis of the top two models for the Bottle Rocker dataset. We have searched for the five best optimizing metrics, and the results are displayed.
We also experimented with modifying the decision threshold for the probability calculation. Choosing a higher threshold has the effect for lowering the number of False Positives, which is extremely import as a False Positive, in general, results in loosing money on a trade.
I would appreciate your comments on this analysis.
Charles Brauer